
Please note: this is an independent, personal project. It was not done for or on behalf of the NHS, and it was not requested, reviewed or endorsed by NHS England or any NHS organisation. It uses publicly available data. The data is NHS England’s A&E Attendances and Emergency Admissions statistics, used under the Open Government Licence v3.0. This is my own analysis, not NHS guidance. Code, SQL and the interactive dashboard are on GitHub.
Background: what is the 4-hour target?
When someone goes to A&E in England, the NHS measures how long it takes from arrival until they are admitted to a ward, transferred to another service, or discharged home. The “4-hour target” is the share of patients for whom that happens within four hours.
There are two numbers to know:
- 95%: the long-standing standard. Set in 2010, it says at least 95% of A&E patients should be admitted, transferred or discharged within four hours. It’s a pledge in the Handbook to the NHS Constitution. England hasn’t met it nationally for several years. (Nuffield Trust: A&E waiting times)
- 78%: the interim target for March 2026. On 30 January 2025, NHS England published its 2025/26 priorities and operational planning guidance. One of its asks was to “improve A&E waiting times and ambulance response times compared to 2024/25, with a minimum of 78% of patients seen within 4 hours in March 2026.” The Urgent and emergency care plan 2025/26, published in June 2025, repeated it.
So 78% was a real, published target with a fixed date. That made it a useful test: with NHS England’s own published data, how close did England get, and what does the data suggest about why?
Since then, NHS England’s Medium Term Planning Framework (2026/27 to 2028/29) has set the next objective at 82%. That’s outside the period of this analysis.
What I did
I’m a business analyst, and I wanted to practise the kind of analysis I’d do on any operational problem: frame the question, check the data, find where the pressure builds up, and suggest what to look at next.
I took NHS England’s published monthly data for every A&E provider from April 2024 to September 2026 (30 months, about 200 organisations a month) and worked through it in SQL and Python. The full analysis, code and an interactive dashboard are on GitHub.
Here’s what I found.
1. The target was missed by less than a point, and the gain didn’t last

Performance stayed between 71% and 77% for the whole 30 months. The best month was March 2026, the target month itself, at 77.1%. Six months later, in September 2026, it was back to 74.4%, about where it was a year earlier.
A peak in the month the target is measured, followed by a fall, suggests a short-term push rather than a lasting change in how the system works. That’s not a criticism of the staff involved. It’s a sign that the underlying problems haven’t moved.
It’s also worth knowing that the headline figure includes minor injury units and urgent treatment centres, which usually see patients quickly. In major emergency departments (Type 1), performance is about 14 points lower: 60.6% in September 2026.
2. Bed pressure is no longer just a winter problem
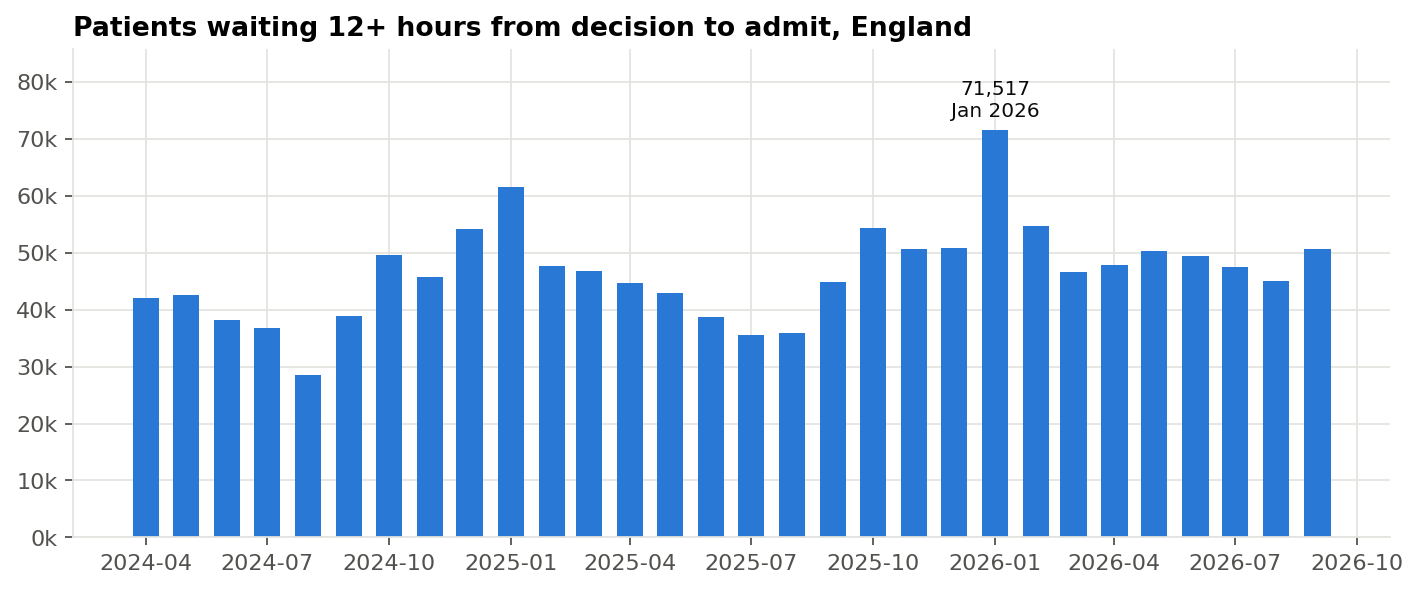
A “trolley wait” is the time between a doctor deciding a patient needs a hospital bed and the patient actually getting one. Long trolley waits mean A&E is full of people who should already be on a ward.
Winter is consistently worse. Each winter, 4-hour performance drops about 3 points and 12-hour trolley waits rise by around 60%. January 2026 was the worst month in the data, with 71,517 patients waiting more than 12 hours for a bed.
The more worrying number is from the summer. Summer 2026 averaged about 47,000 twelve-hour trolley waits a month, 29% more than summer 2025. Hospitals went into autumn with less spare capacity than a year before. Demand is still rising too: attendances in the latest 12 months were about 4% higher than in April 2024 to March 2025.
3. Trolley waits explain only part of the gap between hospitals
The common explanation for poor A&E performance is “no beds”: patients can’t move out of A&E, so everyone else waits longer. The data partly supports this. Trusts with the fewest trolley waits perform about 7 points better on the 4-hour target than those with the most.
But the link is weak.

Across 120 trusts, the correlation between trolley waits and 4-hour performance is only −0.26. Among the 40 trusts with a similar level of bed pressure (10 to 20 twelve-hour waits per 100 emergency admissions), Type 1 performance ranges from 38% to 76%.
If two hospitals have the same pressure on beds but one sees patients within four hours twice as often, beds aren’t the whole story. How the department runs (how quickly patients are assessed, how decisions are made, how same-day emergency care is used) seems to matter as much.
What I’d recommend looking at
If I were working with an urgent care improvement team, these are the questions I’d want answered first:
- Compare matched trusts. Pair hospitals with similar bed pressure but very different results, and find out what the better one does differently. That’s cheaper than building beds and quicker to test.
- Get the missing part of the wait. This dataset only shows the time from decision to admission. Patient-level data (the Emergency Care Data Set) would show how long people wait to be seen and to get a decision. Without that, it’s easy to fix the wrong part of the process.
- Plan capacity for the whole year. Rising summer trolley waits mean discharge and community capacity can’t just be a winter plan.
- Check the data. Twenty trusts report almost no 12-hour trolley waits. For children’s hospitals that’s plausible; for others it may come down to how waits are recorded. Comparisons between trusts are only as good as that recording.
A note on the data
Before analysing anything, I checked that each month’s figures for individual providers added up to NHS England’s published national total. All 30 months matched exactly. My 4-hour figures also match the headline numbers NHS England publishes, for example 75.0% in March 2025. That check takes ten minutes and saves a lot of embarrassment later.
The data has limits. It gives monthly totals, not individual patients. It doesn’t adjust for how ill patients are. And a correlation doesn’t prove one thing causes another.
Please note: this is an independent, personal project. It was not done for or on behalf of the NHS, and it was not requested, reviewed or endorsed by NHS England or any NHS organisation. The recommendations are my own suggestions based on public data. The data is NHS England’s A&E Attendances and Emergency Admissions statistics, used under the Open Government Licence v3.0. This is my own analysis, not NHS guidance. Code, SQL and the interactive dashboard are on GitHub.
Sources for the targets: NHS England, 2025/26 priorities and operational planning guidance (30 January 2025) · NHS England, Urgent and emergency care plan 2025/26 (June 2025) · Nuffield Trust, A&E waiting times