
Real public data. Built on real NHS England public data (Open Government Licence v3.0). The analysis and recommendations are my own and are not NHS guidance.
- Audience
- An NHS operational improvement team, such as a regional urgent care board
- Sector
- Healthcare
- My role
- Business / data analyst, independent analysis
- Data
- NHS England monthly A&E statistics, Apr 2024 – Sep 2026: 207 organisations, 5,905 organisation-month rows
- Methods
- Problem framing, data dictionary, reconciliation, seasonality, quartile and correlation analysis
- Executive summary
- Framing the question
- Data: sourcing, checking and documenting
- Findings
- The dashboard
- Recommendations
- Limitations and next steps
Executive summary
The NHS standard is for 95% of A&E patients to be admitted, transferred or discharged within 4 hours. The interim target for March 2026 was 78%.
National performance has sat between 71% and 77% for 30 months while attendances keep rising (about 4% up year on year). The common explanation is a shortage of beds, shown by long “trolley waits” after the decision to admit. If that's wrong, money and effort go to the wrong fix.
Is the bottleneck inside A&E, or in the flow of patients out of A&E into the hospital?
Both, but beds explain less than expected. Trusts with fewer trolley waits do perform better, yet the link is weak (r = −0.26) and trusts with similar bed pressure range from 38% to 76%. How each department runs matters as much as bed numbers, so the first step is peer learning between matched trusts.
1. Framing the question
Before touching the data I turned a broad worry (“A&E is struggling”) into three questions an improvement team and its stakeholders could act on. The 4-hour standard is the headline KPI, so the first step is a gap analysis against the 78% target:
- How has 4-hour performance changed month by month, and how seasonal is it?
- Which regions and trusts are furthest from the target, and is the gap closing?
- Is poor 4-hour performance linked to trolley waits, i.e. is the problem flow out of A&E?
Each question maps to a specific SQL query and a chart, so every number in the recommendations can be traced back to its source.
2. Data: sourcing, checking and documenting
NHS England publishes one CSV per month at provider level. I downloaded 30 months (April 2024 to September 2026), and a Python loader standardises the column names, which change between releases, and writes the result to a DuckDB database for the SQL queries.
- Reconciliation: for every month, the organisation rows must add up to the published national total before any analysis runs. A mismatch stops the load.
- Data dictionary: every field is defined, including the difference between Type 1 departments (major emergency departments) and all A&E types, which is easy to mix up.
- Fair comparisons: trusts merge and change over time, so the trust analysis uses only the 120 trusts with a full 12 months of Type 1 data.
- Rates, not counts: trolley waits are compared per 100 emergency admissions so large and small trusts can be compared.
Data flow
NHS England CSVs → Python loader (clean, standardise, reconcile) → DuckDB → 7 SQL queries → CSV results → Jupyter charts and a Plotly dashboard → findings paper.
3. Findings
Finding 1: the target was narrowly missed, and the gain didn't hold
Performance peaked at 77.1% in March 2026, 0.9 points short of 78%, then fell back to 74.4% by September, almost exactly where it was a year earlier. Type 1 departments ran about 14 points below the all-types figure throughout. The March peak looks like a short-term push towards the target, not a lasting change.

Finding 2: bed pressure is no longer just a winter problem
Each winter, performance falls about 3 points and trolley waits rise by about 60%. The new signal is summer: average monthly 12-hour trolley waits in summer 2026 were 47,285, 29% higher than summer 2025. Hospitals went into autumn with less spare capacity than a year before.
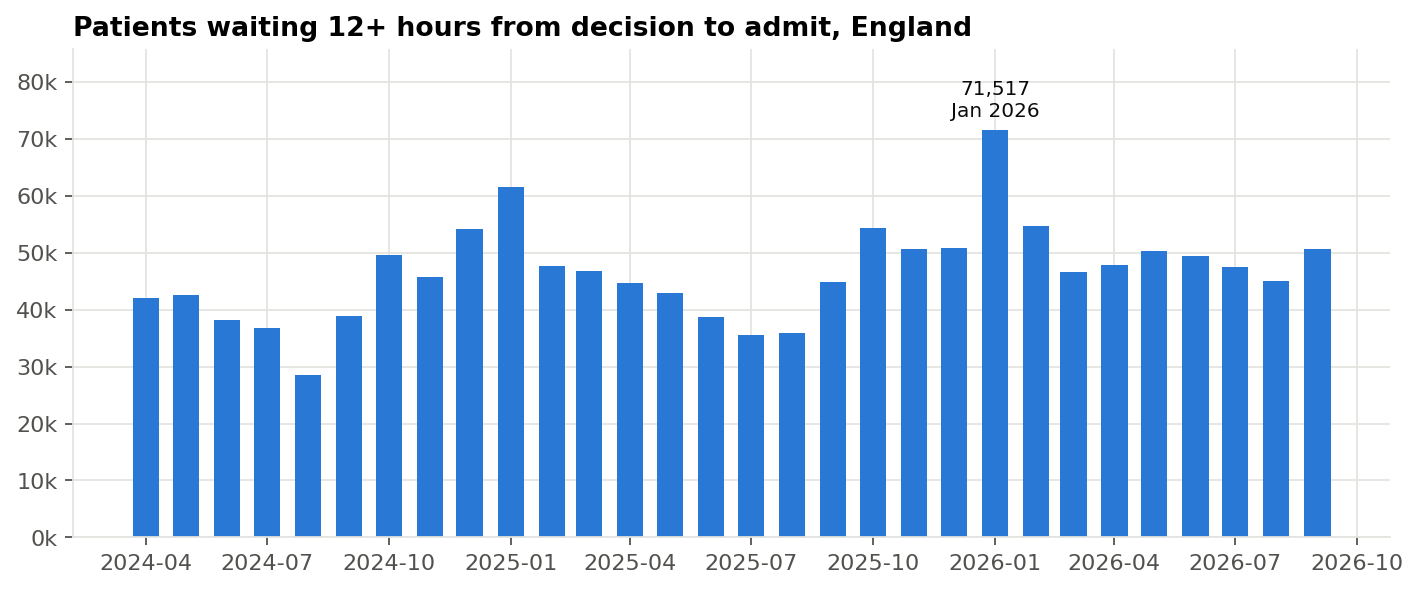
| Period | 4-hour (all types) | Avg 12-hour trolley waits a month |
|---|---|---|
| Summer 2024 | 75.4% | 34,469 |
| Winter 2024/25 | 72.5% | 54,453 |
| Summer 2025 | 76.0% | 36,686 |
| Winter 2025/26 | 73.4% | 58,985 |
| Summer 2026 | 75.1% | 47,285 |
Finding 3: no region reached 78%, and the South West went backwards
Six of seven regions improved slightly year on year, with London best at 77.4%. The South West fell from 72.7% to 71.8% and has the lowest Type 1 performance (56.5%). The Midlands and North West combine low performance with the highest trolley-wait rates, about 18 per 100 emergency admissions.

Finding 4: beds explain only part of the gap between trusts
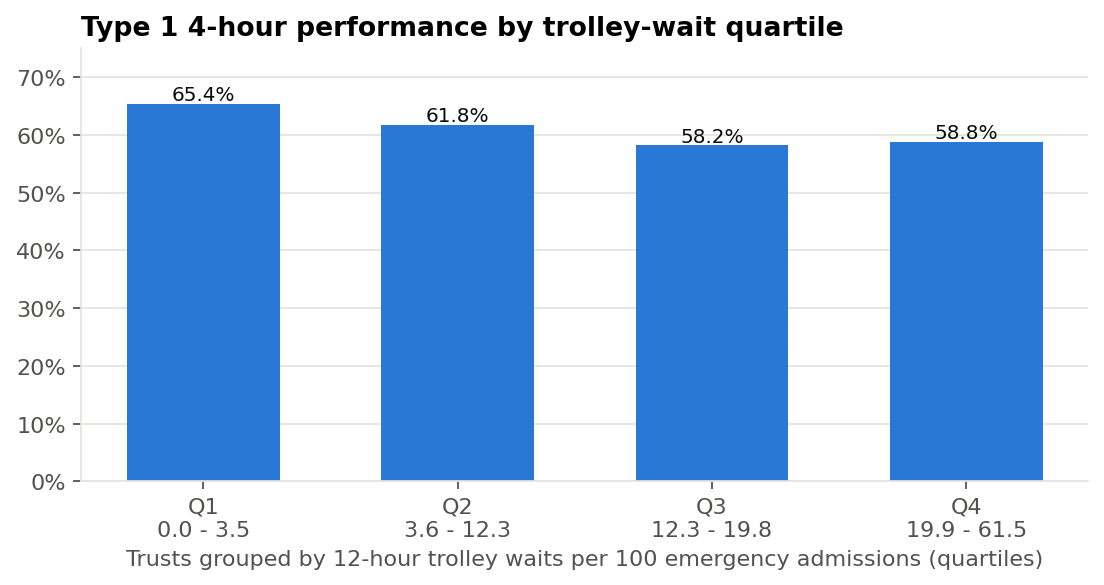
I split the 120 trusts into quartiles by trolley-wait rate. The quarter with the fewest trolley waits performs about 7 points better than the quarter with the most, but there is no further drop between the third and fourth quartiles, and the correlation across trusts is weak (r = −0.26).

So what?
Among the 40 trusts with 10 to 20 trolley waits per 100 admissions, Type 1 performance ranges from 38% to 76%. Trusts under the same bed pressure get very different results, so the way each department runs is where to look next.
4. The dashboard
To make the findings usable by people who won't open a notebook, I built a single-page interactive dashboard with headline figures, the national trend, trolley waits and regional performance. It is published on GitHub Pages, so anyone with the link can use it.

5. Recommendations
Framed as next steps for an operational improvement team, each with a measure so progress can be checked:
| # | Recommendation | Why | How to measure |
|---|---|---|---|
| 1 | Peer-learning visits between matched trusts: pair trusts with similar trolley-wait rates but very different performance and compare how their departments run. | Bed pressure alone doesn't explain the gap | Type 1 performance of the lower-performing trust, 6 months on |
| 2 | Get arrival-to-decision times before designing fixes, using the Emergency Care Data Set, so the root cause of each delay is known. | This dataset only shows the last stage of the wait | Share of over-4-hour waits explained by each stage |
| 3 | Plan bed capacity for summer as well as winter. | Summer trolley waits up 29% year on year | Monthly 12-hour trolley waits, summer 2027 vs 2026 |
| 4 | Prioritise the South West, Midlands and North West. | Lowest performance; South West getting worse | Regional 4-hour performance against 78% |
| 5 | Check how trolley waits are recorded at the 17 adult trusts reporting almost none. | Inconsistent recording distorts comparisons | Trusts with unexplained near-zero reporting |
6. Limitations and next steps
- Monthly totals only: no patient-level waits, causes of delay or case mix.
- Trolley waits are measured from the decision to admit, not from arrival.
- Correlation is not cause. Trusts with fewer trolley waits may differ in size, patient mix or the community support around them.
- Next step: add Emergency Care Data Set stages and hospital bed occupancy to test the flow question directly.
What this shows about my approach
Starting from a decision-maker's question, checking the data before trusting it, testing the popular explanation instead of assuming it, and ending with recommendations that each have an owner-friendly measure.
Methods, deliverables and further reading
Every method and tool in this case study links to its page in my BA toolkit or glossary. Here they are in one place:
Deliverables on GitHub
More case studies
Practice case study · Retail
Online Returns: From Email and Spreadsheets to Self-Service
A full requirements pack for a UK retailer whose online refunds took 12 days: stakeholder analysis, as-is and to-be process maps, BRD, user stories, RTM and a UAT plan.
Read case study →Practice case study · Social housing
Generative AI Adoption: Triage of Tenants' Repair Emails
An AI adoption assessment: options appraisal, requirements, UK GDPR and DPIA screening, a pilot plan and a Hugging Face prototype tested on synthetic emails.
Read case study →